

IPS 3D Sensor Processing
The IPS 3D sensor processing supports three basic functions:
Ø Display of 3D data sets from ASCII (.dat) files in UTM (Northing, Easting and depth format) or in latitude, longitude and depth (.txt). An example of a UTM text file is:
Date (yyyy-mm-dd) HHMMSS.zzz, X-Northing, Y-Easting, Depth [m]
2006-03-28 102721.607,10.602,-4.944,4.944
2006-03-28 102721.707,10.631,-4.869,4.950
2006-03-28 102721.807,10.659,-4.793,4.970
2006-03-28 102721.907,10.687,-4.718,4.983
Note- Date-time data is used for 3D calibration and 3D data times may be shifted if required to match the appropriate navigation time tags using the time bias option.
Ø Conversion of 3D sensor data from local (sensor) coordinates to geodetic coordinates.
Ø 3D sensor calibration using established Multibeam calibration Patch test methods.
IPS 3D Data Display
The IPS 3D data display allows a user to load ASCII X,Y,Z text files into a 3D display environment. A concise pop up menu that is activated by right clicking on the 3D display window has the following options: Home, Center, Rotate, Zoom, Pan, Info, Make Wpt, Load File, Add Data File, Make VRML File, Save as BMP and Clear Plot.
IPS 3D Calibration
The IPS supports the calibration of 3D sensor data (x,y,z) using the standard Multibeam patch test method. That is the IPS solves for the three mounting angles of the 3D sensor with respect to the navigation coordinate system (Heading, Roll and Pitch). The patch test method starts with the user collecting the calibration data in three separate runs. Each of the three calibration runs are designed to minimize the effect of the other two variables and maximize the error effect on the angular variable in question. For example, to collect calibration data for determining the 3D sensor roll mounting angle (with respect to the navigation coordinate system) one would collect 3D sensor data over a flat bottom either by running a down and back pattern over the same patch of flat bottom or by spinning the 3D sensor over a flat section of the sea floor (i.e. ROV). The 3D data is then imported into the IPS as an ASCII text file in the following format in either UTM Northing, Easting, depth or Latitude, Longitude and depth.
|
File Format:
|
|
|
|
Date (yyyy-mm-dd) HHMMSS.zzz, X-Northing, Y-Easting, Depth [m]
|
|
|
|
2006-03-28 102721.607,10.602,-4.944,4.944
|
|
2006-03-28 102721.707,10.631,-4.869,4.950
|
|
2006-03-28 102721.807,10.659,-4.793,4.970
|
|
|
|
|
The user then enters the initial estimate of the mounting angles and the sensor x,y,z offsets with respect to the platforms center of roll & pitch (CRP). Next, if required, the user should enter a time bias to map or modify the 3D sensor data point time tag to match sync to the IPS navigation time (figure 1). The user then clicks on the “3D calibration” option that pops-up another dialog box that allows the user to select the angle of interest, the maximum range that the mounting angle should be in and several other values as described below. The IPS will then process the data file in the following manner:
-
Open and read in the ASCII 3D sensor text file.
-
Assign the navigation data to the individual 3D data points using time tags and user specified time bias.
-
Step through the range of mounting angles for the variable in question (heading, roll or pitch) based upon the users initial mounting angle guess, angle error range and angle interval. The results of this process are displayed in the IPS calibration plot that shows the optimum mounting angle at the minimum of the plot.
-
The 3D data can then be displayed in the IPS 3D Viewer to visually verify that the new mounting angle improved the overall data quality. Figures 2 and 3 show the before and after 3D plots from a roll test.
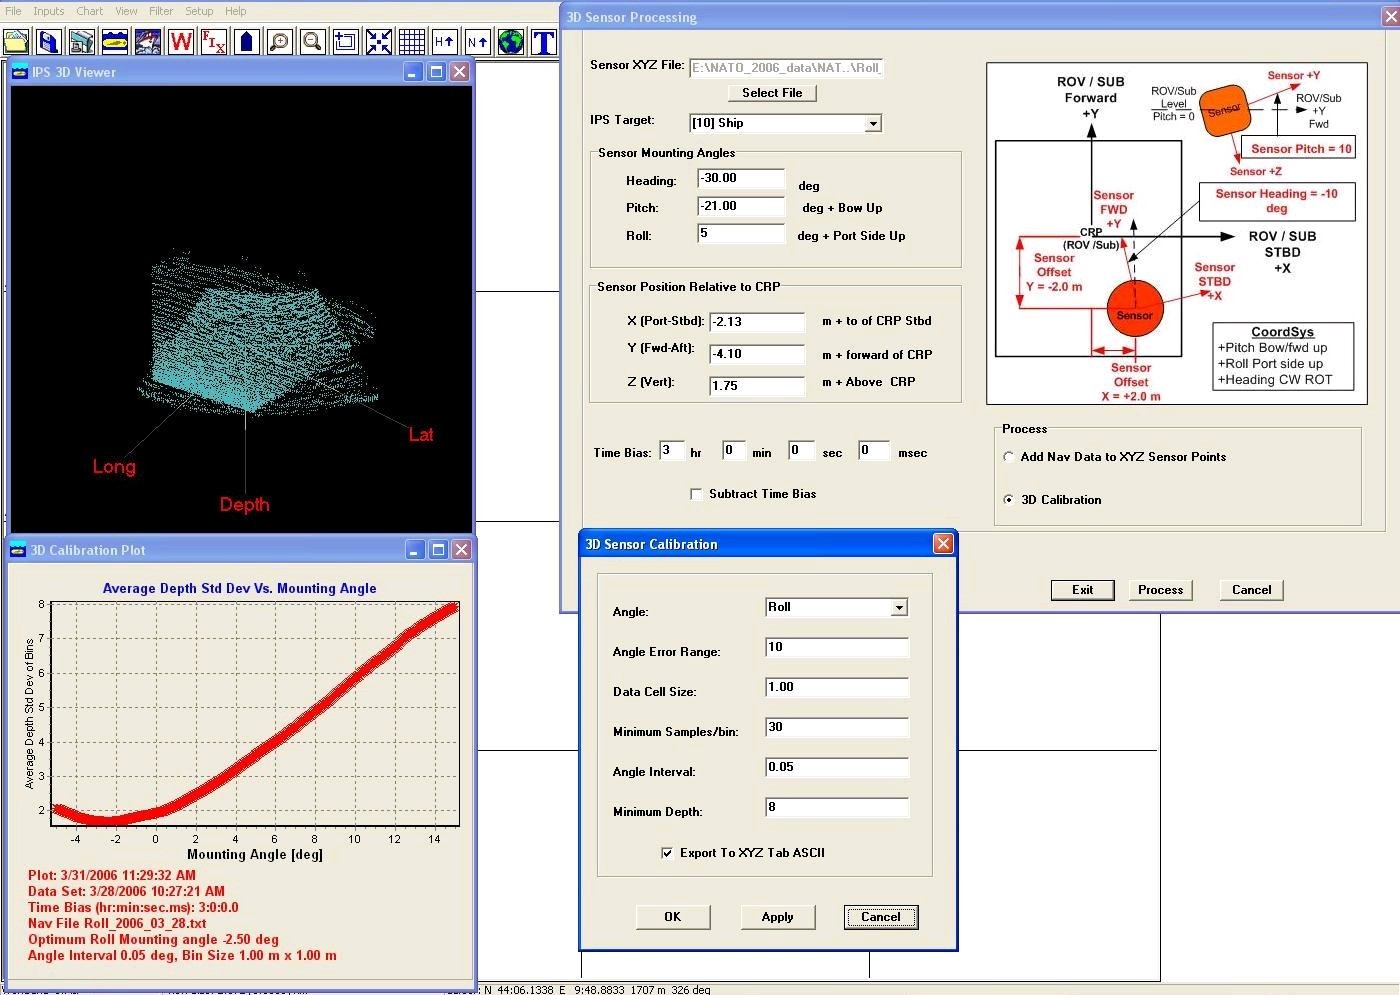
Figure 1. IPS 3D sensor calibration dialog boxes, graphical QC plot and 3D plot.
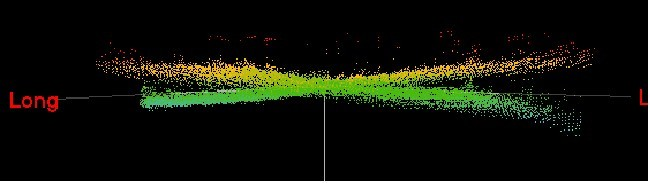
Figure 2. Side view of raw georeferenced roll calibration data displaying the effects of a roll bias between the navigation coordinate system and the 3D sensor.
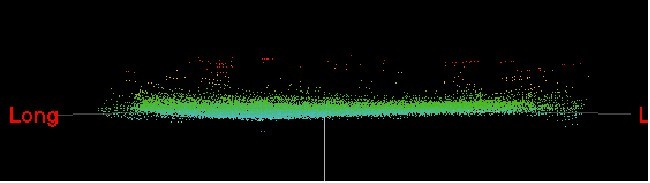
Figure 3. Side view of the corrected georeferenced roll calibration data after the new roll mounting angle as determined by the IPS has been applied.